Analytics overviews
Wix Analytics: Understanding the Traffic Overview
Your Traffic Overview displays traffic patterns over time, identifying trends as well as highlighting opportunities for growth.
Check your site's traffic metrics, like sessions by device, country, new vs. returning visitors and more. In this article, you'll learn about all potential metrics you may see.
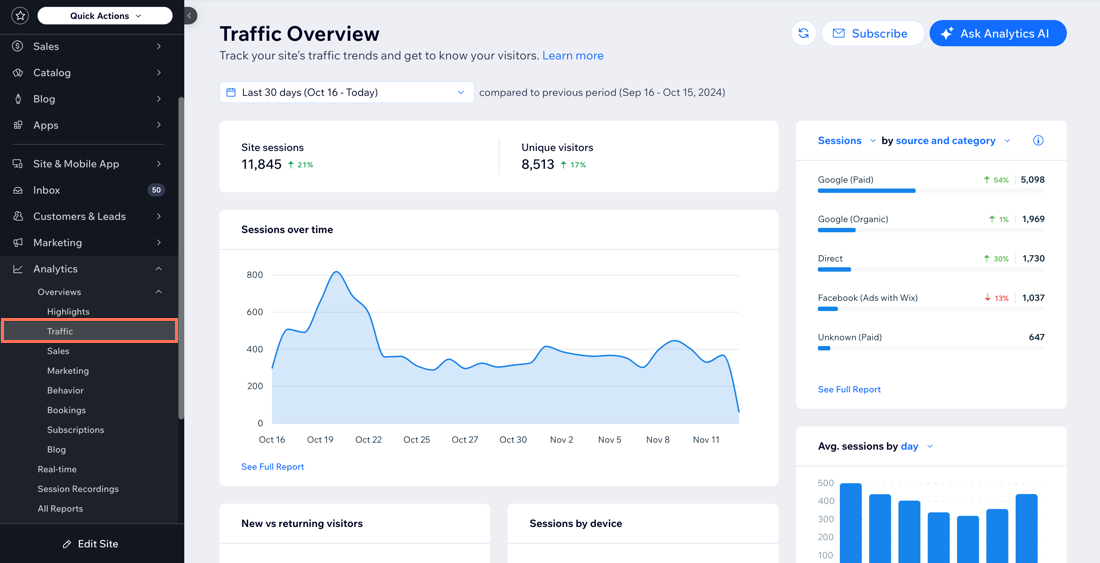
You can find the Traffic Overview page in the Overviews section under Analytics in your site's dashboard.
Curious about your site visitors?
Note:
Traffic from any visitors who have not accepted the site's cookies (or are using certain types of ad blockers) will not appear in these reports. If you see discrepancies in your site (e.g. someone purchased an item from your store but you can't see the site session) this could be why.
Site sessions and unique visitors
A session is a web visit of a site visitor. A session starts when a visitor reaches your site, and ends after 30 minutes of inactivity. In each session there can be multiple page views and actions performed by a visitor, and each visitor can visit more than once.
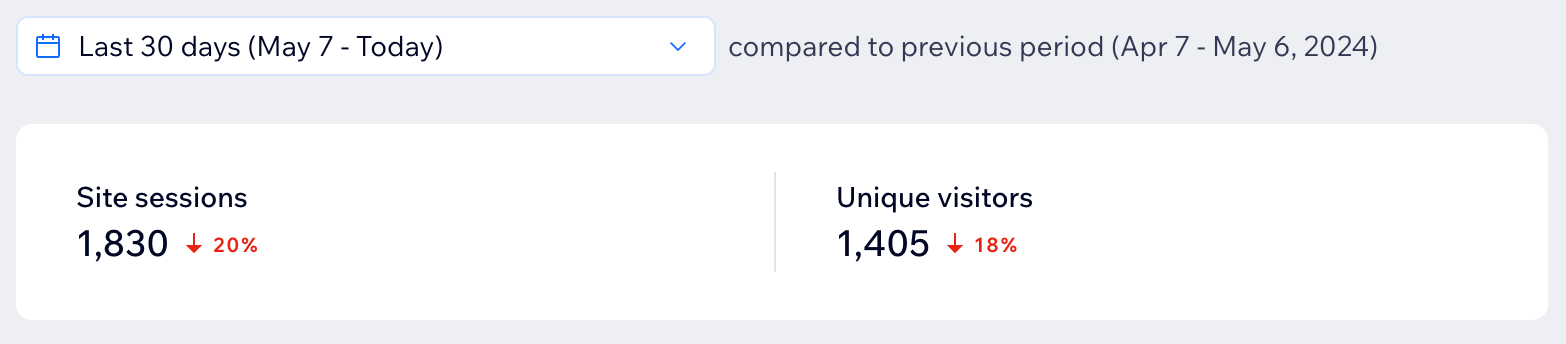
A unique visitor is a person who visited your site, unique by device and browser. Therefore, if the same person visits from 2 different devices, they will be counted as 2 different visitors.
The trend shown next to the metric demonstrates how the metric has changed compared to the previous period (equivalent to the selected period). A red trend indicates a decrease in activity, while a green trend indicates an increase in activity.
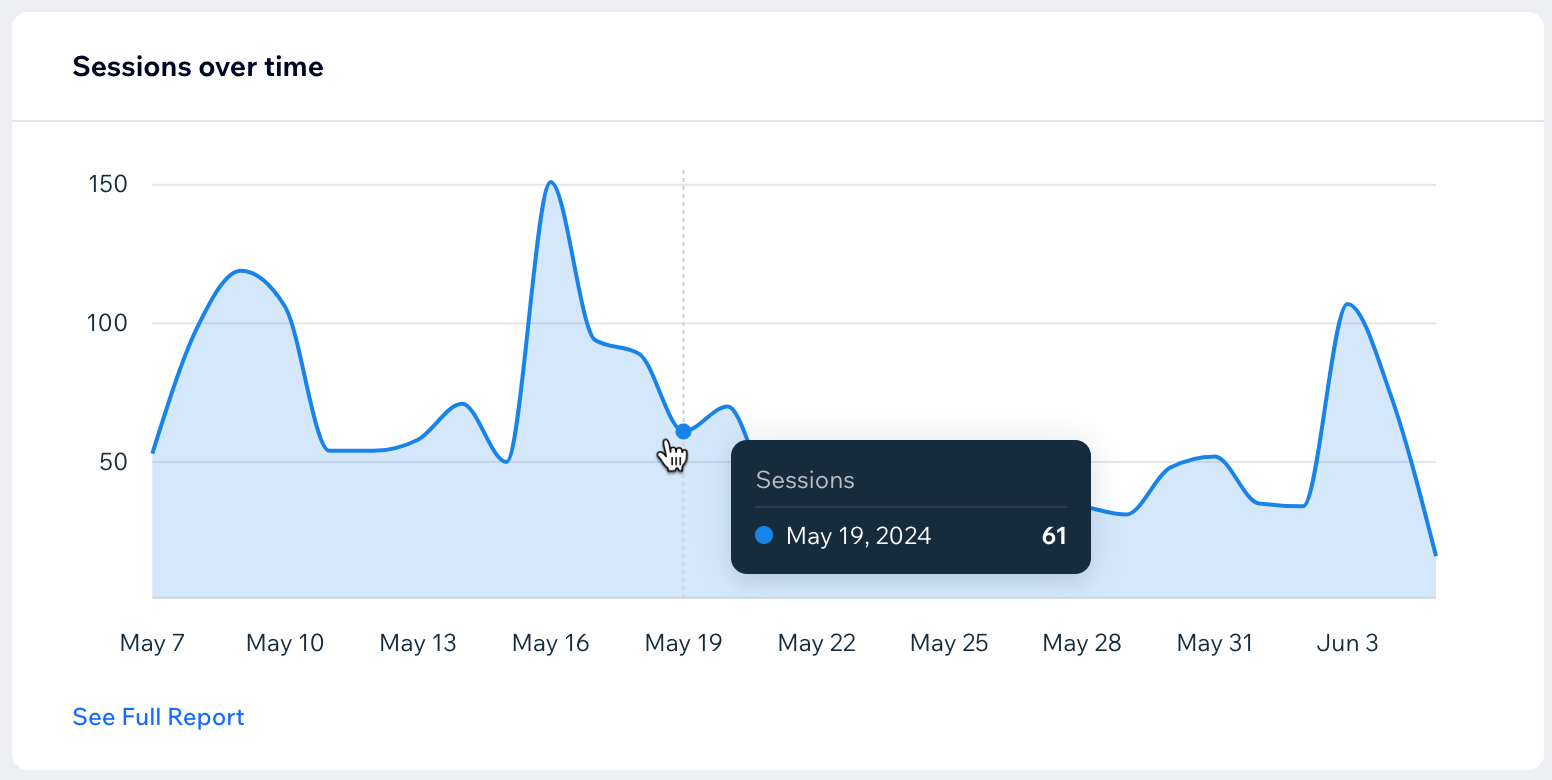
Sessions over time
This graph allows you to view your site sessions over time. View seasonal trends and pinpoint spikes in traffic to determine the most impactful time to share new content, plan promotions or launch new campaigns.
Hover over the graph to see the exact number of sessions on each date.
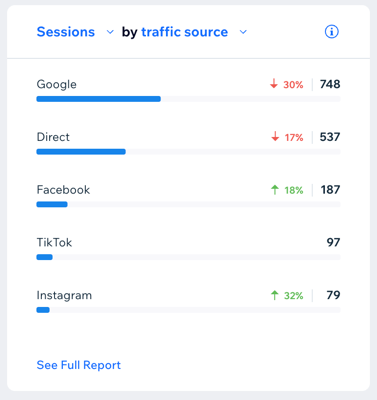
Sessions and visitors by source and category
Understand where your site visitors are coming from to effectively tailor your content, reach your target audience and take your traffic to new heights.
See which external sites are driving traffic to your site, as well as the category they belong to. Click the drop-down to filter by source, category, or both.
Traffic source: The sites that people are navigating to your site from (e.g. X.com, Medium.com).
Traffic category: The category of sites that people are navigating to your site from (e.g. social, email, organic search).
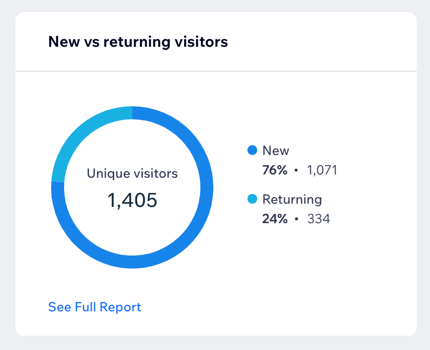
New vs. returning visitors
This chart shows the amount of new visitors, returning visitors, and the total unique visitors to your site. Gauge audience retention and loyalty while developing your knowledge of the site's appeal to new visitors.
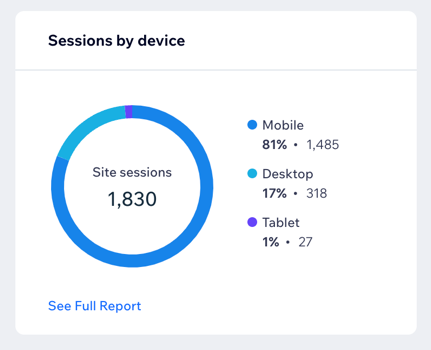
Sessions by device
This chart shows the amount of visitors to your site using a desktop, mobile, or tablet. Explore the devices used by visitors to optimize your site layout, enhance accessibility and expand your site reach.
What else can I learn about my visitors?
Sessions by country
This metric shows you the countries your visitors are located in when they visit your site. Explore the countries with the highest engagement, give your marketing efforts specific focus and customize your content to suit different cultures.
Click on the map to explore sessions by city and (when applicable) by state.

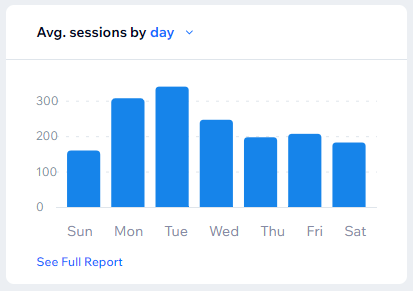
Average sessions by time
Make informed decisions about the best day and time to update your content, post your new blog or add exciting products to your store.
View a graph of the average number of sessions your site gets per day. Hover over a day to see the exact number. Click the day drop-down to change the metric to average sessions per hour.
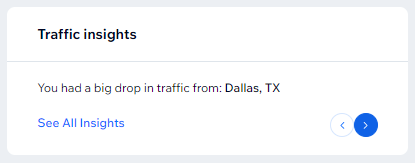
Traffic insights
Discover a range of information and identify the areas that you can grow your site the most. Insights are takeaways based on your data from the last 30 days. In this section, you can see insights from the most popular page to the page where most of your traffic drops off.
Open the Insights page to see more traffic insights and other types of insights regarding different areas of activity.
Looking for more data?
Click the date picker drop-down at the top of the Traffic Overview to change the time period that data is pulled from (the default is 30 days).
Click See full report in a section to see an in-depth report about that activity. Learn more about your traffic reports.
FAQs
Click a question to learn more about the Traffic Overview.
How can I learn more about my site’s traffic (who, when and from where visited my site?)
You can learn more about your site's traffic by checking out your traffic reports.
How can I make the most of the Traffic Overview data?
Regularly review the Traffic Overview data to understand your audience better, identify trends, and make data-driven decisions to improve your site's performance and grow your business.
Why is there a discrepancy in my traffic data?
Traffic from visitors who have not accepted the site's cookies or are using certain types of ad blockers will not appear in these reports. If someone purchased an item from your store but you can't see the site session, this could be why.
What should I do if I see a sudden spike in traffic?
Investigate the source of the spike by checking the Sessions and Visitors by Source and Category section. Determine if a particular campaign, social media post, or external website is driving the traffic. Leverage this information to replicate successful strategies.
Why am I seeing a spike in traffic from a specific country?
When your site is published, it can be accessed by anyone. In this case, the reports are simply reflecting the traffic. It is possible that some of this traffic is due to bot traffic but it could also be normal fluctuations.
If the spike seems irregular, for example the spike is very high for no reason, contact us and we will be happy to help.
What should I do if I notice a drop in traffic from a specific area?
If you notice a drop in traffic from a specific area, consider tailoring your marketing efforts to re-engage that audience. Use insights from the Traffic Overview to identify potential issues and opportunities for improvement.
Why am I seeing traffic for unexpected locations but I'm not promoting my site?
When your site is published, it can be accessed by anyone. In this case, the reports are simply reflecting the traffic. It is possible that some of this traffic is due to bot traffic but it could also be normal fluctuations.
If the traffic seems irregular, for example it shows a lot of traffic from a location far from you but there's no traffic around your business's location, contact us and we will be happy to help.
Can I subscribe to the Traffic Overview?
Yes, you can subscribe to the overview and receive the data directly to your email. The email includes sections that correspond to those found in your dashboard, providing you with a comprehensive view of your site’s traffic.

To subscribe on the dashboard:
Go to Traffic Overview in your site's dashboard.
Click Subscribe at the top right.
Choose how often to get the overview (Monthly, Weekly, Daily) or set your own preferences.
Click Subscribe.
To subscribe on the Wix app or Wix Studio app:
Go to your site in the Wix app or Wix Studio app.
Tap Manage.
Tap Analytics and select Traffic Overview.
Tap the Subscribe icon
 at the top right.
Choose how often to get the overview (Monthly, Weekly, Daily) or set your own preferences.
Tap Subscribe.
Note: If you don't have any site traffic, the email will show that there is no data recorded.

