Analytics reports
Wix Analytics: About Your Traffic Reports
With Wix Analytics traffic reports you can find out how visitors find and navigate around your site. Drill down into your reports to answer questions like "How many people visited my site through a marketing email in the last 30 days?"
Analyze your site traffic over time or during a specific time of the day. You can also see which locations, devices, and site pages are bringing the most viewers to your site.
Filtering your own visits from traffic reports:
If you are logged into your Wix account, any visits you make to your own site using the same device & browser won't be counted in traffic reports.
Note: Other metrics outside traffic reports (e.g. store orders, event RSVPs, post likes and comments) still include your interaction(s) as the site owner. For example, the number of times you view a blog post is still counted in the total post views.If you wish to exclude a specific IP address from your traffic reports, please vote for this feature and we'll keep you updated.
How to access your traffic reports
Types of traffic reports
Click a report type to learn more about it.
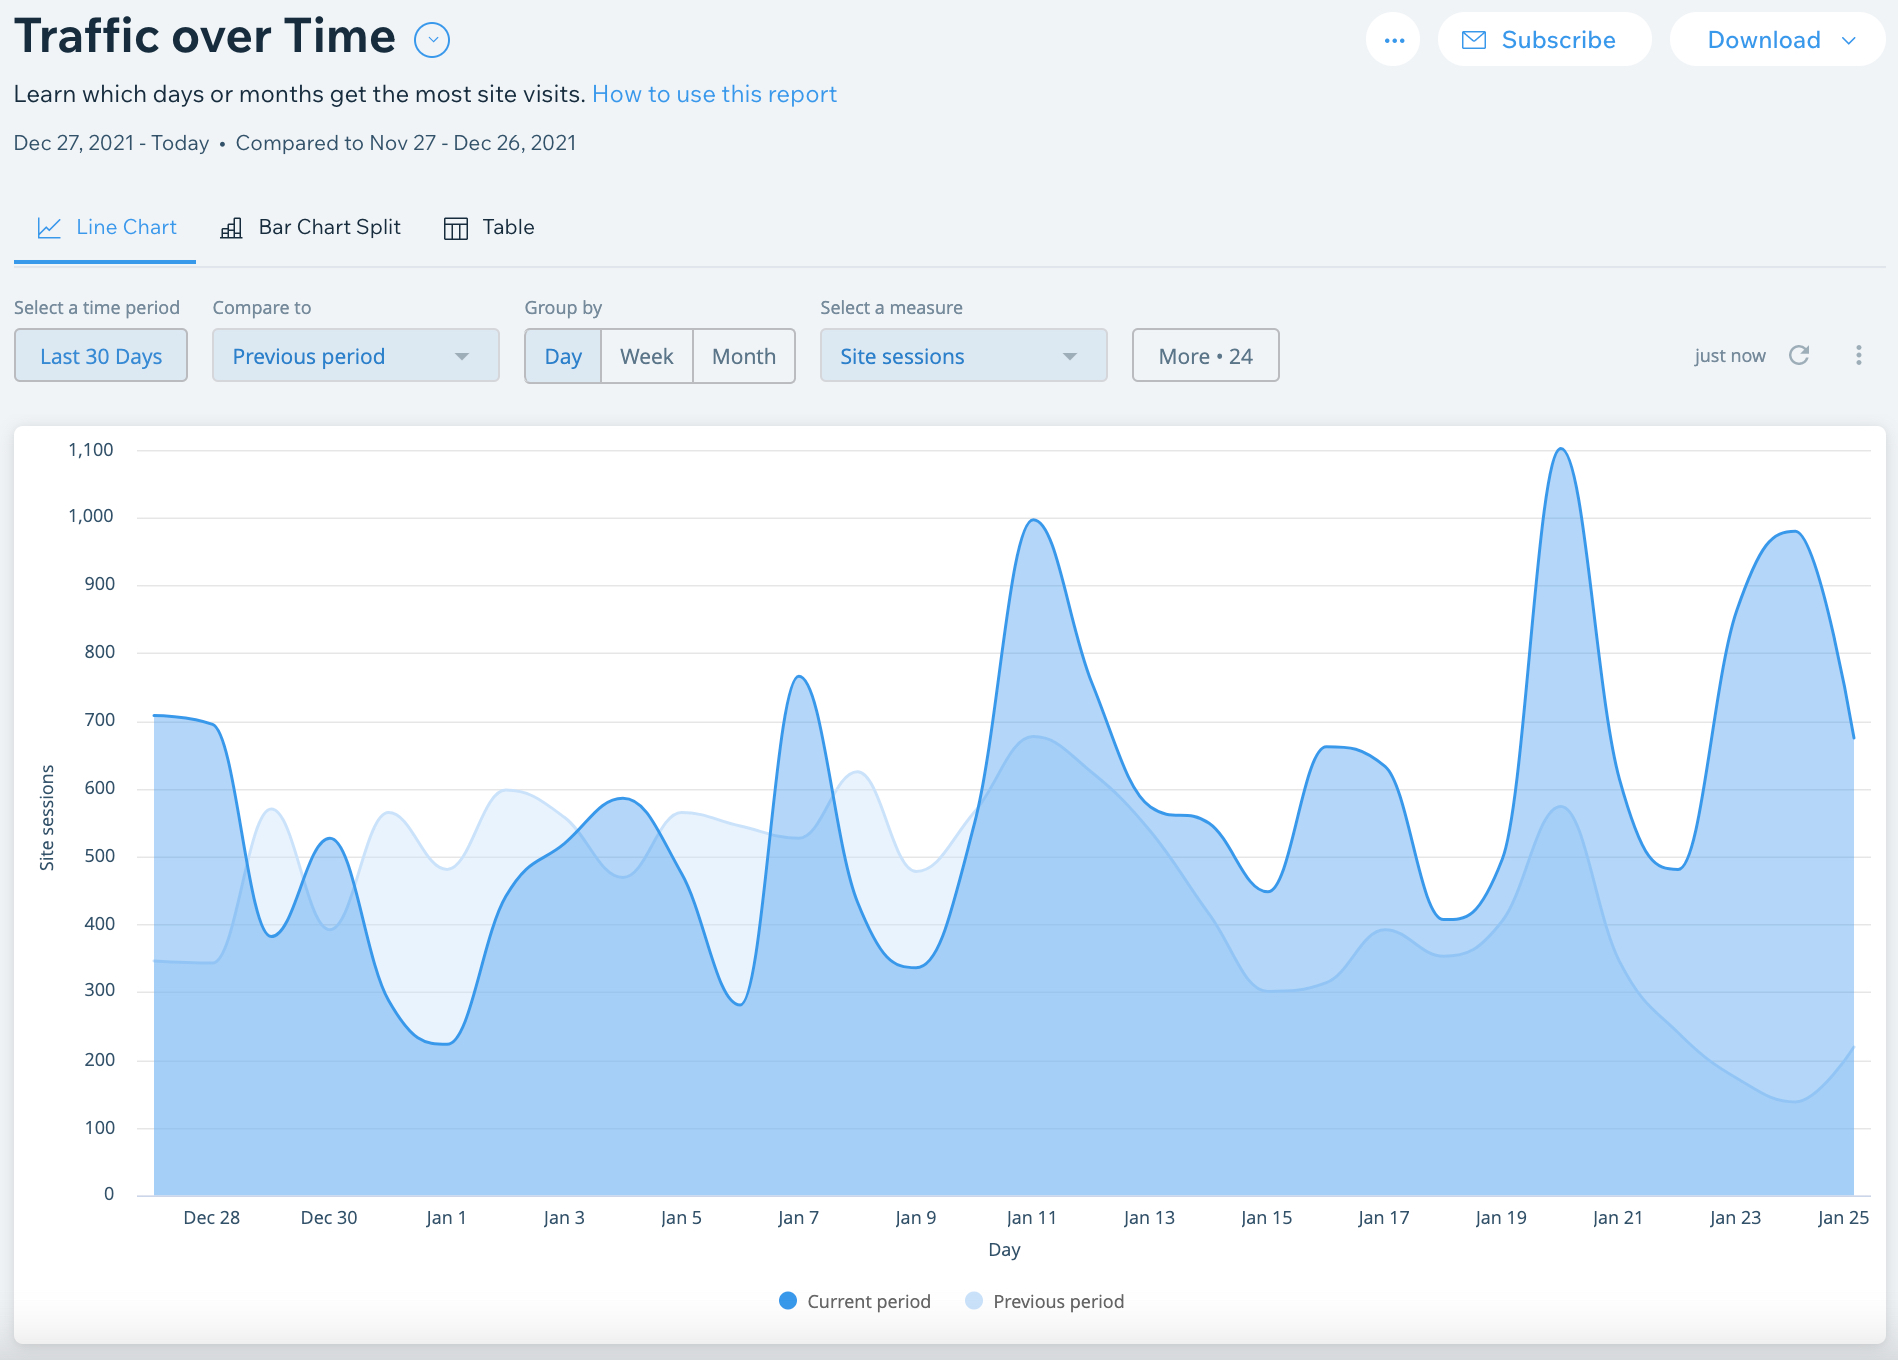
Traffic over time
Learn which days or months get the most traffic on your site. Use this report to identify trends in traffic over different time periods.
Traffic by time of day
See which time of the day is most active for site visitors. The heat map displays the hours people are most visiting your site. The darker the color, the more people are viewing
Tip: If you have Wix Chat on your site or are deciding on business hours, use the data in this report to make sure you are available during peak periods.
Traffic by entry page
See which site page visitors land on first when entering your site.
Tip: Make sure the most important call-to-actions are visible on the pages that visitors are landing on the most.
Traffic by location
See where in the world you are getting the most traffic. You can filter the information by country map or city map.
Use this report to:
Optimize your marketing efforts or paid campaigns to the locations where you are getting more traffic.
Prioritize locations where you want to increase your marketing presence.
Note on location accuracy: We are working on improving the accuracy of traffic by location reports. In isolated cases, you may see inaccurate city names, or ‘N/A’ where the information from IP addresses is untrusted or unknown. Site traffic received through VPN, anonymizers, cloud providers, and bots can affect the accuracy of this data.
Traffic by device
See if people are viewing your site from desktop, tablet, or mobile.
Use this report to:
Make sure your site on mobile is up-to-date and functions for your mobile visitors.
Create offers and content that are targeted to specific devices.
New vs. Returning visitors
See how much site traffic comes from new visitors vs. visitors who have viewed your site before. You can use this report to tailor marketing activities and promotions to visitors at different stages.
FAQs
Click a question below to learn more about Wix Analytics traffic reports.
How do I switch views within a report?
Click the relevant tab at the top of the report to access different chart types: Line/Bar Chart, Line/Bar Chart Split, or Table.
Note: Depending on the traffic report you may see different viewing options such as Heat Map or City or Country Map.
How do I view report definitions?
Click into a report and then click View report definitions under the report name to see the terminology of that report.
What is a traffic category vs. a traffic source?
A traffic category refers to the broader category where traffic is coming from (e.g. paid social traffic vs. organic social traffic). A traffic source is the specific site where traffic came from (e.g. Facebook.com, Google.com).
How can I customize which metrics show on a traffic report?
Click Select columns at the top of a Table report. Then select the checkboxes for the data you want to see. Some examples include Visitor type, site member, browser or device type, IP address, and operating system.

