Managing purchased plans
With Subscriptions reports you can explore sales, status of pricing plans, product subscriptions, and recurring invoices. Find out which of your subscriptions generate the most revenue, expected revenue from in the next six months, which subscriptions are due to expire, and more.
In this article, learn more about:
How to access your Subscriptions reports:
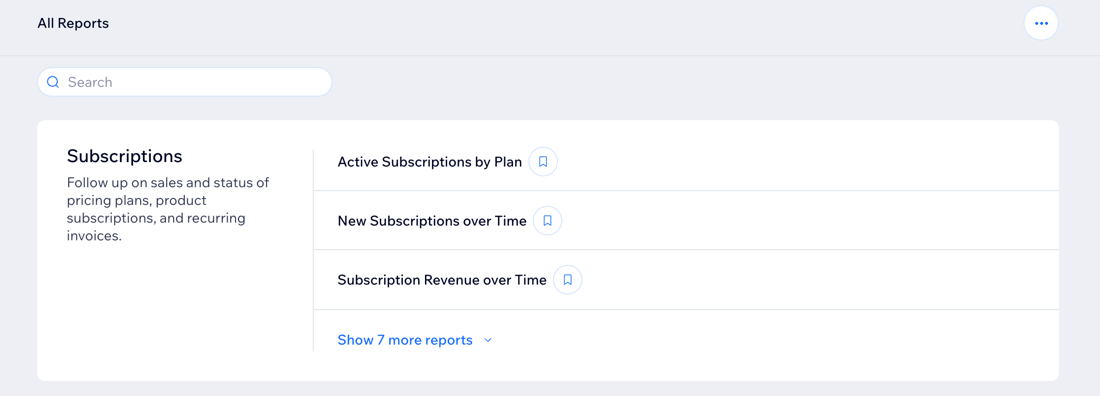
Go to All Reports in your site's dashboard and scroll down to the Subscriptions section. You can also check out the Subscriptions Overview to view all the key metrics for your business.
Types of Subscriptions reports
Access the report you need to gain insights into your subscription plans and revenue trends. Analyze active subscriptions, subscription revenue, new subscriptions, and more to understand your subscription performance better.
Click a report type below to learn more about it:
Active Subscriptions by Plan
The active subscription by plan report allows you to get a breakdown of active subscriptions by plan.
Use this report to:
See which subscription plans are most popular.
Understand how different plans are doing to improve your offerings and marketing efforts.
New Subscriptions over Time
The new subscriptions over time report allows you to compare subscription sales over different time periods.
Use this report to:
Watch how new subscriptions are growing and spot any trends or unusual changes.
Measure the success of marketing campaigns by looking for increases in subscriptions when campaigns run.
Subscription Revenue over Time
The subscription revenue over time report lets you find out how much revenue is generated from subscriptions over different time periods.
Use this report to see:
Total subscription revenue.
Analyze one-time payments revenue (i.e. money earned from single-payment subscriptions).
Recurring payments: Money earned from recurring payments for existing subscriptions, not including first payments.
First payments: Money earned from first payment instances of recurring plans.
Revenue by Subscription
Your revenue by subscription report shows which subscriptions bring you the most revenue.
Use this report to see:
Total revenue by subscription plan name.
One-time payments revenue: Money earned from single-payment subscriptions.
Recurring payments: Money earned from recurring payments for existing subscriptions.
First payments: Money earned from first payment instances of recurring plans.
New Subscriptions by Plan
The new subscriptions by plan report lets you discover which pricing plans gained the most subscriptions over different time periods.
Use this report to:
Find out which pricing plans are popular.
Compare how new and old plans are performing so you can make adjustments if needed.
Expected Revenue from Recurring Payments
Use your expected revenue from recurring payments report to see how much revenue you're expected to receive from active subscriptions over the next six months.
Use this report to:
Know your expected revenue from subscriptions.
Adjust your strategies if the expected revenue is lower than desired.
Note: This report shows expected revenue from recurring subscriptions that are currently active. New subscriptions and subscriptions that might be cancelled before their end date are not taken into account in this report.
Active Subscriptions over Time
Use your active subscriptions over time report to see how many active subscriptions you have by comparison to a previous period, or compared to last year.
Use this report to:
See which of your subscription plans are most popular over time.
Find out about your customer's preferred payment methods.
Note: When data is grouped by week or month, the report counts every plan that was active during this time period, even if it expired later in the week or month.
Expiring Subscriptions
Use the expiring subscriptions report to find out which subscriptions are expiring soon or have already expired.
Use this report to:
Find which customers have expiring subscriptions to offer them renewal deals.
Prepare for big drops in active subscriptions and find ways to prevent it.
Retention over Time
The retention over time report lets you see how groups of customers who subscribed in the same month stayed subscribed over time.
Use this report to:
Understand how long customers tend to stick with your service.
Identify any drop-off points to improve your retention strategies.
Ended Subscriptions Breakdown
Use this report to find out if subscriptions expired, were canceled, or discontinued due to failed payments.
Use this report to:
See the number of subscriptions by the type of ending reason: canceled by business, canceled by client, payment failed, or expired.
Spot trends in why subscriptions end.
Want to customize your report?
You can customize the data you're viewing and the way it's displayed. You can also save the views you want to return to later.Learn more about customizing your report.
FAQs
Click a question below to learn more about your Wix Analytics Subscriptions reports.
Where can I learn about the terminology used in these reports?
Subscriptions reports include a glossary that defines the terms used. Click View report definitions under the report name to see the terms defined.

Learn more about the Wix Analytics glossary.
How do I save my favorite reports so that I can access them quickly?
Click the Add to Saved reports icon  next to a specific report to add it to your saved reports at the top of the All Reports page.

How do I change the type of graph in the report?
On the All Reports page, hover over a report to see the different views available. The offered graphs vary according to the type of report (e.g. tables, line charts, maps). 
If you're already viewing a report, you can switch between report views at the top to access different types of graphs.