Google PageSpeed Insights is a tool that tests your site page's performance for both desktop and mobile. This tool uses the Chrome User Experience (CrUX) report to analyze real visitor performance and Google Lighthouse to give your page a performance score.
Want to access PageSpeed Insights?
Click here to enter your page's URL and view your performance report.
Understanding your PageSpeed Insights score
When reviewing your PageSpeed Insights score, you can view different types of data depending on your site and needs. Your site's pages have separate Mobile and Desktop reports because the experience of your visitors may differ based on the device they use to view the site.
Google PageSpeed Insights has two distinct sections, each serving a unique purpose:
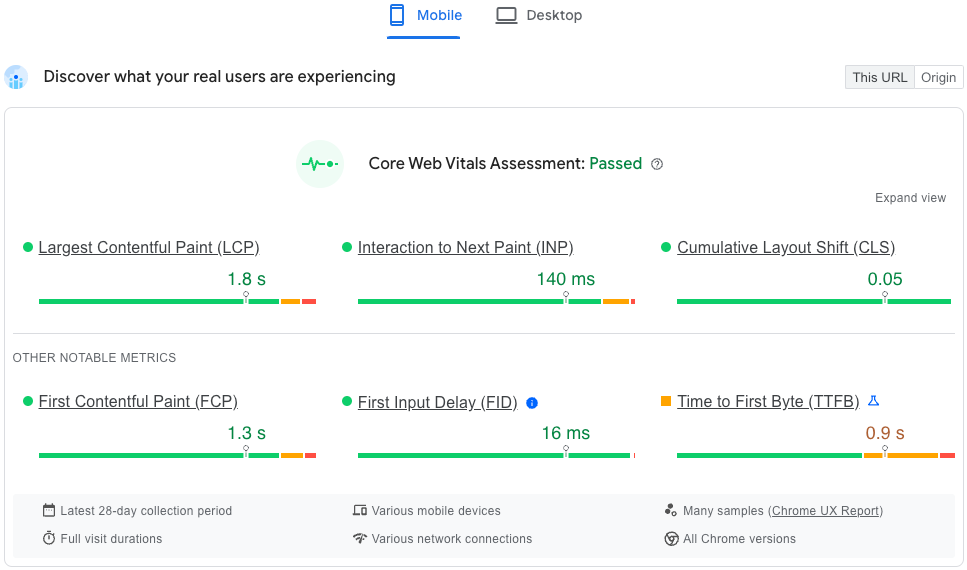
Discover what your real users are experiencing - Core Web Vitals Assessment: This section uses Field data to monitor the experience of your real site visitors. It is only available on pages that have a sufficient amount of traffic from real visits and interactions.
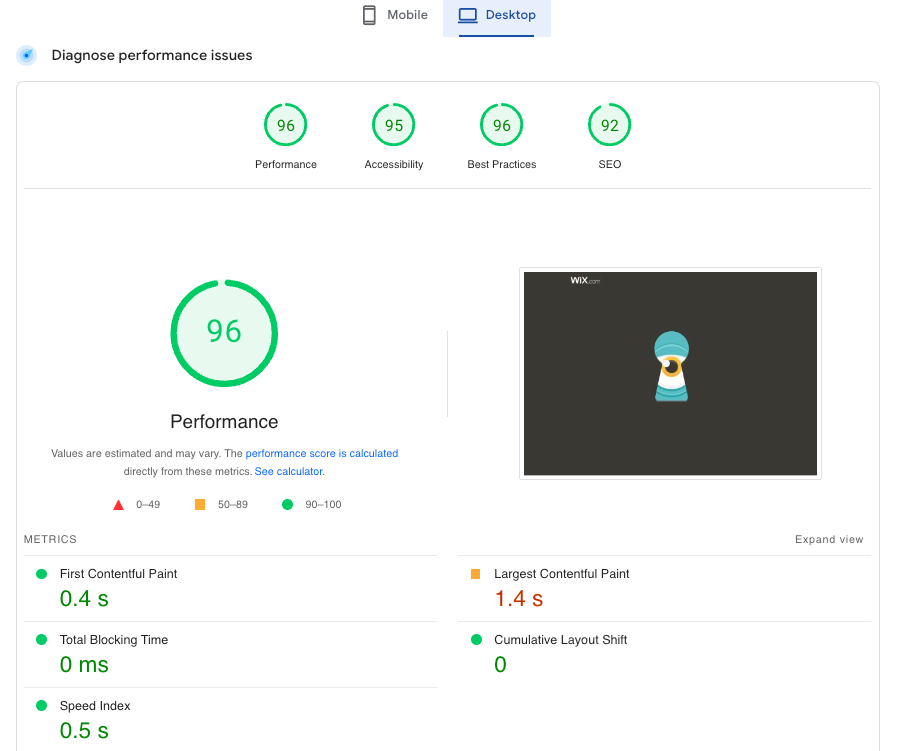
Diagnose Performance Issues - Performance score: This sectionuses Lab data to estimate the experience of your potential visitors. Google simulates a low-end mobile device with a slow internet connection to estimate the score.
About the Core Web Vitals Assessment
The Core Web Vitals Assessment enables you to view the average metrics for the past 28-day period. Any modifications to your site will gradually influence the metrics each day until the full impact can be measured within 28 days.
Field data offers the most accurate measure of your site's performance and pinpoints performance improvements you can take on your site. The Discover what your real users are experiencing section presents performance metrics gathered from actual visitors to your stie.
The Core Web Vitals Assessment is released on a monthly basis, so improvements can take time to appear within the PageSpeed Insights. The field data is gathered from every Chrome session by visitors who have not opted out of reporting to Google.
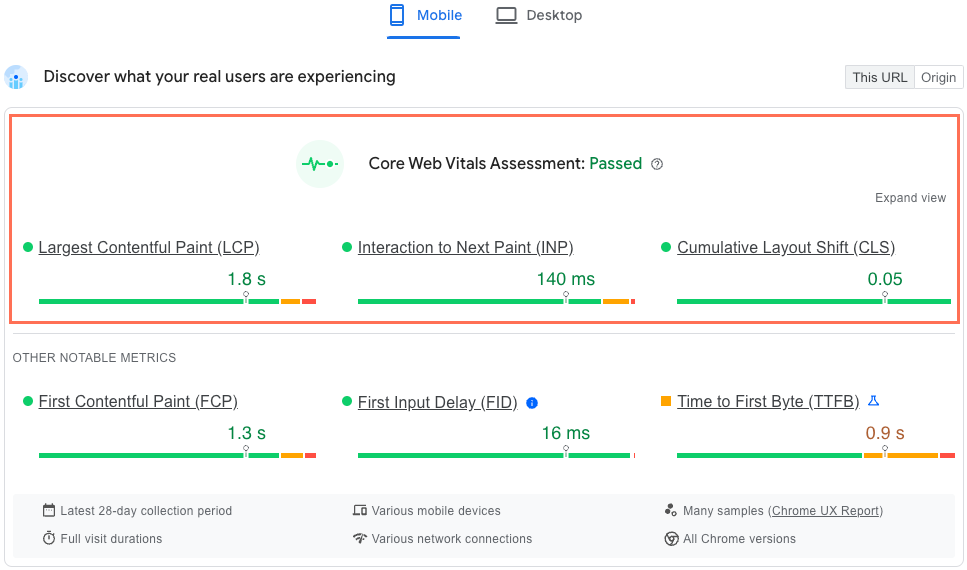
Google's Core Web Vitals Assessment includes the following metrics:
Largest Contentful Paint (LCP): An indication of a site's loading time - more specifically, how long it takes for the largest content element in the site's viewport to load.
Interaction to Next Paint (INP): An assessment of your site's responsiveness to all click, tap, and keyboard interactions that occur throughout each visit on every page. The final INP value is the longest interaction observed.
Cumulative Layout Shift (CLS): A measurement of unexpected movements of elements that change the layout of the page.
View other notable metrics
In addition to the Core Web Vitals (CWV) Assessment metrics, there are two other notable metrics:
First Contentful Paint (FCP)
Time to First Byte (TTFB)
Although these metrics may offer insights into areas for potential improvement, they are not part of your CCWV Assessment and do not impact your site's standing with Google.
Results of the Core Web Vitals Assessment
The results of your Core Web Vitals Assessment, gathered from the latest 28-day collection period, can vary based on the devices used and network connection.
Click below to learn about each possible result:
No assessment
If the page analyzed by Google PageSpeed Insights hasn’t received enough traffic, rather than the assessment, you’ll see “No Data”.
This report analyzes real-world data, from publicly discoverable pages that are sufficiently popular, to provide a representative and anonymous view of the page’s performance.
Note: Google has not disclosed the exact, minimum number of visits required for real visitor data (CrUX).
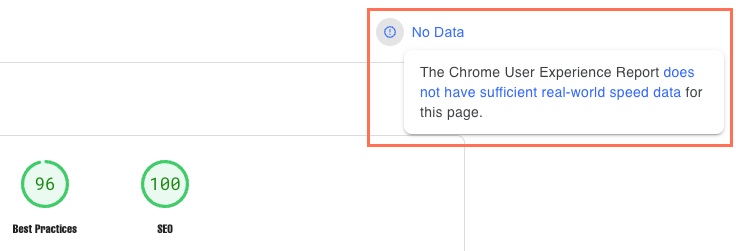
Tip: The Wix Site Speed dashboard has a lower threshold for page views, which allows you to see real user insights quicker than Google PSI. The dashboard is based on Wix Analytics data, so you are not limited to visits that occur only on Chrome browsers.
Passed assessment
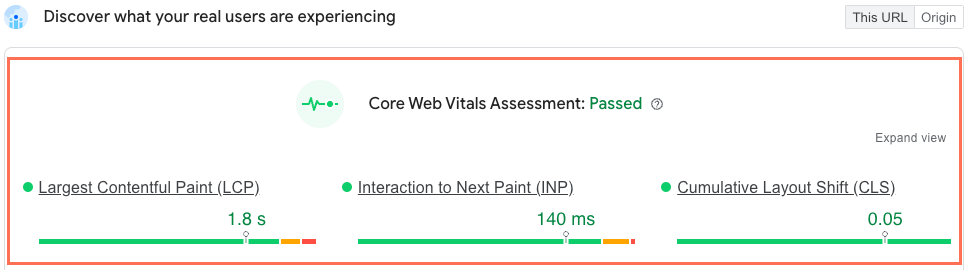
For a web page to pass the Core Web Vitals Assessment, it must receive a ‘Good’ score for all three Core Web Vital metrics:
Largest Contentful Paint (LCP): Elements must appear on the page within 2.5 seconds of when the page first began loading.
Interaction to Next Paint (INP): The longest recorded response time must be within 200 milliseconds of the interaction.
Cumulative Layout Shift (CLS): Maintain visual stability by keeping CLS below 0.1.
Failed assessment
Your Core Web Vitals Assessment will display as 'Failed' unless you receive a 'Good' score for all three metrics: LCP, INP, and CLS. If your URL does not pass the assessment, it means one or more metrics need improvement.
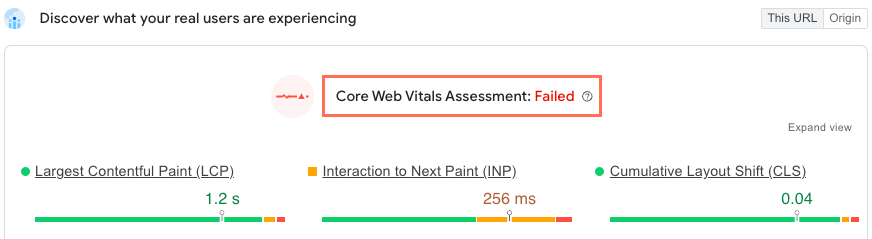
We recommend reviewing our specific suggestions on how to improve each Core Web Vital metric included in the assessment.
If changes are made and the score does not improve within the next 30 days, contact us for assistance.
Missing metrics
Some pages may have a Core Web Vitals Assessment, but the INP metric is unavailable and grayed out. This is often because the pages haven't received enough traffic to meet Google's threshold for inclusion in the assessment. However, other potential reasons include:
The visitor loaded the page but never clicked, tapped, or pressed a key on their keyboard.
The visitor loaded the page, but interacted with it using gestures that did not trigger INP. For example, scrolling or hovering over elements does not trigger INP.
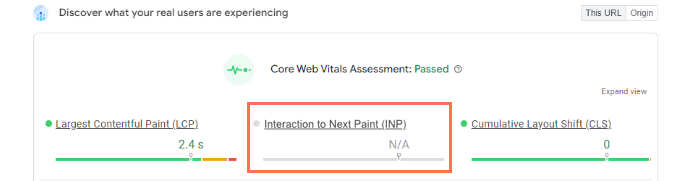
It’s less likely for LCP or CLS to be excluded as the metric is tracked once the page loads, and does not require an additional interaction to trigger the metric, unlike INP.
This URL vs. Origin
If the analyzed URL hasn't received sufficient traffic, but your entire site has, instead of displaying "No Data," you'll see a Core Web Vitals Assessment under the Origin tab.
Origin combines the traffic for all pages on your site to aggregate the real visitor data.
The This URL tab remains grayed out until the URL receives enough traffic for a page-specific Core Web Vitals Assessment.
SEO and Core Web Vitals Assessment
Core Web Vitals are an important indication of your site's performance, and one of the many measurements used to determine your site's SEO ranking.
The performance SEO boost is applied to mobile and desktop pages separately. Each mobile page, and each desktop page can receive up to three boosts, one for each Core Web Vital:
Good: Metric scores receive a Full SEO boost (green)
Needs Improvement: Metric scores receive a Partial SEO boost (yellow)
Poor: Metric scores receive No SEO boost (red)
For instance, a mobile page might get a partial SEO boost for LCP and INP, but a full boost for CLS.
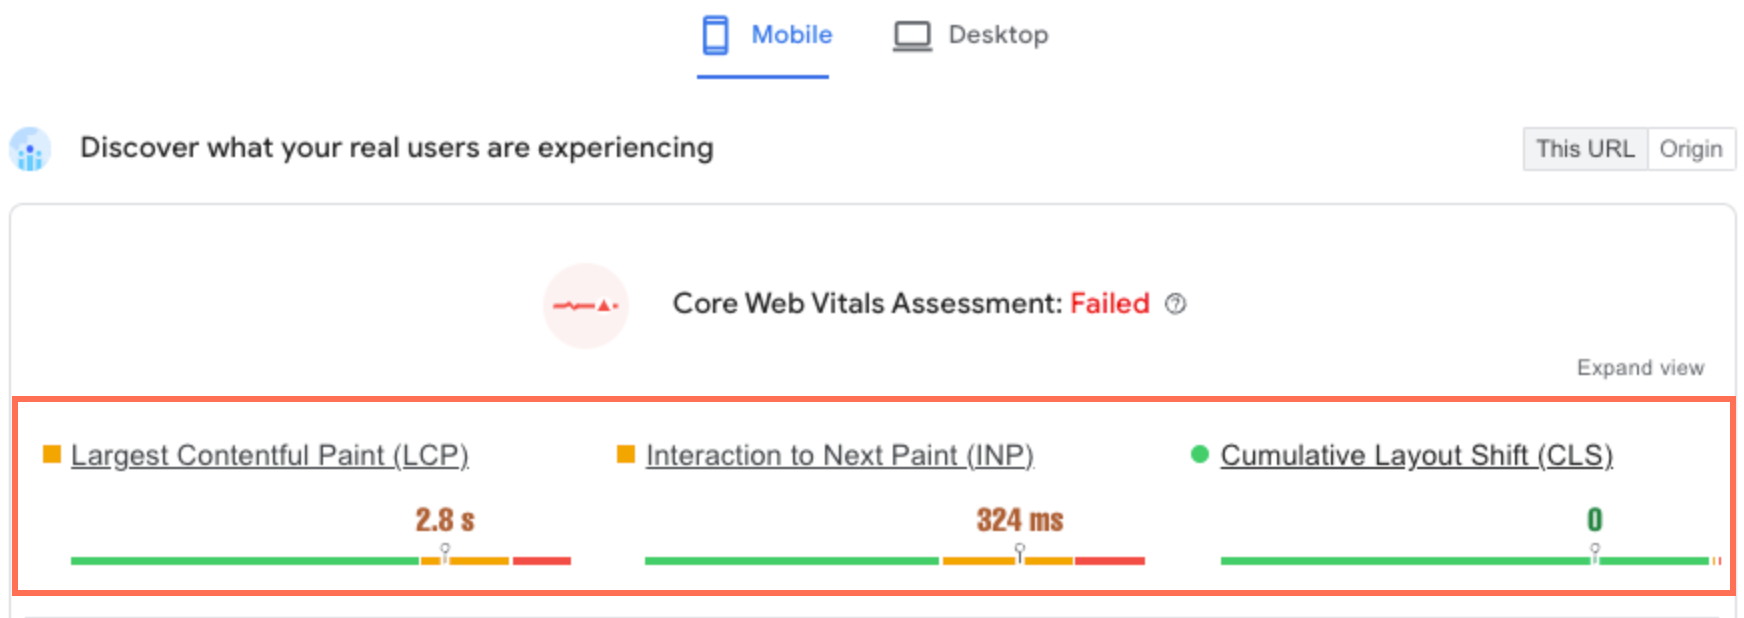
While the desktop version of the same page gets a full SEO boost for each metric: LCP, INP and CLS.
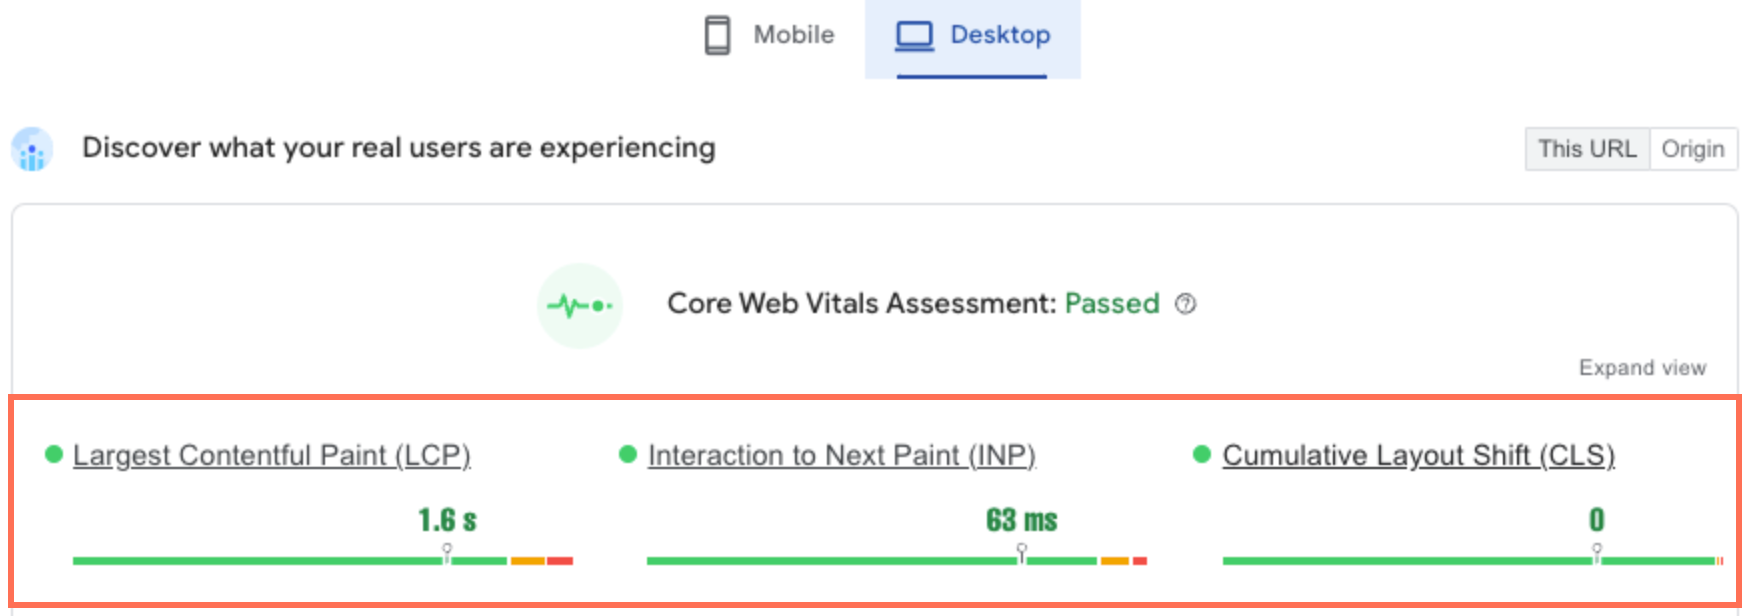
Your Core Web Vitals Assessment will show as ‘Failed’ unless you receive a ‘Good’ score for all three Core Web Vital metrics. This does not mean the page hasn’t received a boost, as each metric contributes a boost independently.
Google Search always seeks to show the most relevant content, even if the page experience is sub-par. For most queries, there is a lot of helpful content available, so having a great page experience can contribute to success in search ranking.
Content remains the most important factor in maintaining your SEO score. We recommend optimizing your site's content, as well as updating your page's meta tags. Learn more SEO best practices.
Lab data and the performance score
To generate your performance score, Google uses Lighthouse, which is an open-source, automated tool for improving the quality of your web pages. Every time a page is analyzed in PageSpeed Insights, Google estimates the score based on simulated environments:
Desktop: Simulates a desktop Chrome browser with Google Lighthouse V11.
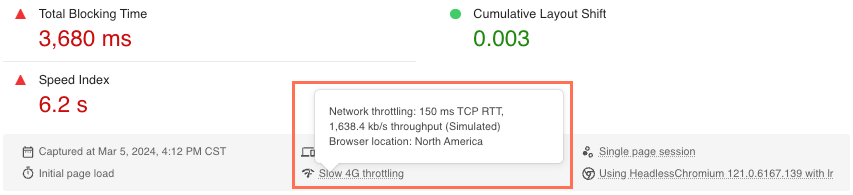
Mobile: Simulates a Motorola “Moto G Power” mobile device, using a slow 4G internet connection.
Important:
If your page has sufficient traffic, focus on the Core Web Vitals Assessment metrics. Real user data always offers a more accurate picture of how visitors experience your site.
If your page doesn't have enough traffic for field data, Google will only show the simulated lab score, which uses an outdated mobile device on a throttled network to reflect a worst-case scenario. A low score here doesn't mean your site is underperforming for real visitors. Check the Wix Site Speed Dashboard instead — if your Core Web Vitals are green there, your real-world performance is not impacted.
Your performance score is calculated using the following metrics:
First Contentful Paint (FCP)
Total Blocking Time (TBT)
Speed Index (SI)
Largest Contentful Paint (LCP)
Cumulative Layout Shift (CLS)
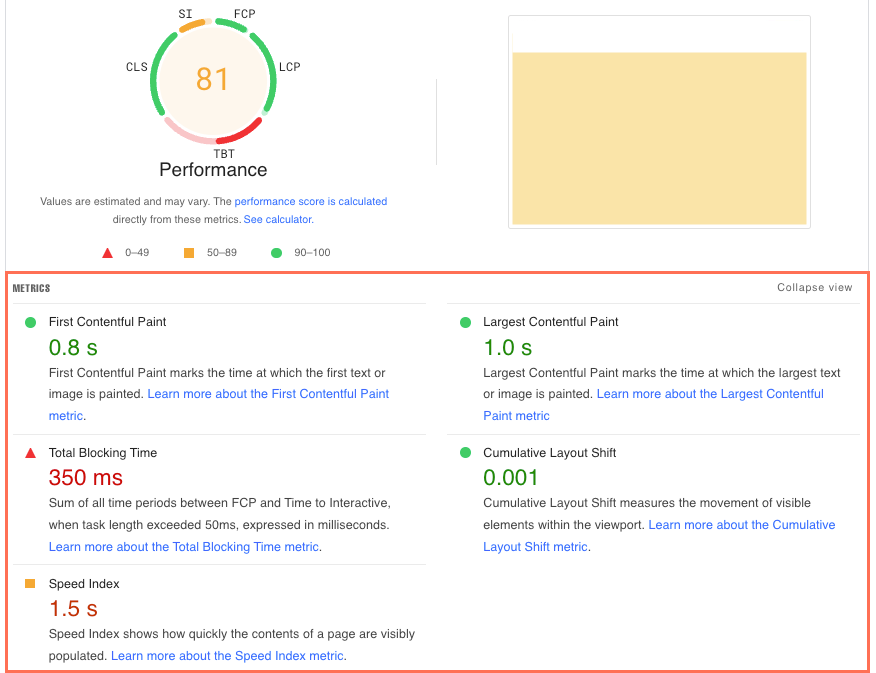
Learn more about Lighthouse performance scoring from Google.
Mobile and desktop variations
Google Lighthouse, the tool that calculates the performance score, simulates mobile loading with the conditions of a mid-tier device (Moto G4) on a slow network (4G). For desktop, it simulates an emulated-desktop computer with a wired connection.
The different scores on mobile and desktop are due to the simulated environments' varying processing power.
PageSpeed also runs in a Google data center that can vary based on network conditions. You can find out where the test was done by checking the location in the Lighthouse Report's environment block.
Mobile sites often have slower performance compared to desktop sites due to factors like larger images, animations, or third-party scripts. To improve your mobile site’s speed, use lightweight image formats like WebP or AVIF and avoid animations in above-the-fold content. Limiting the use of custom fonts and sticking to standard fonts can also enhance performance. Simplify your mobile layout by hiding unnecessary elements using the Mobile Editor. These steps can help ensure your site offers a smooth and optimized experience for mobile users.
Improving Your Homepage Loading Speed
A homepage with too many elements can negatively affect loading speed. To make your homepage load faster, try reducing the number of images and videos, or move non-essential sections to separate pages. Creating a simplified homepage version can also make a big difference in performance. Enabling caching further improves loading speed for repeat visits. Simplifying your homepage not only provides a better user experience but also helps guide visitors through a clearer and more focused user journey.
Largest Contentful Paint (LCP)
Largest Contentful Paint (LCP) measures the time it takes for the largest visible element, such as a hero image or header text, to load in the user's viewport. To improve your LCP score, you can optimize the largest element by reducing the size of hero images or system fonts for large text. Additionally, placing heavy content, such as videos or animations, below the fold and implementing lazy loading for non-critical images can significantly enhance the speed and efficiency of your site.
Blocking Time
Blocking time refers to delays caused by JavaScript execution or third-party scripts, which can make your site less responsive. Minimizing or removing unnecessary third-party apps or scripts is one way to reduce blocking time. Instead of external code, use Wix's built-in tools whenever possible. For any non-critical scripts, you can add the defer attribute in the Custom Code section to ensure other site assets load first. By reducing blocking time, you can improve your site's responsiveness and overall user experience.
Improving Site Speed Consistency
Site speed can sometimes fluctuate even after optimization. These fluctuations are often caused by factors like server response time, visitor location, or cached content. To maintain consistent performance, use a Content Delivery Network (CDN) to serve content globally and regularly check your site's speed using Wix's Site Speed dashboard. Additionally, review third-party apps or scripts that might be causing delays. Speed metrics may take up to three weeks to reflect recent updates, so it’s important to stay patient while monitoring the effects of your optimizations.
FAQs
Click below for answers to common questions about PageSpeed Insights reports.
What’s the difference between Google PageSpeed Insights, Chrome User Experience (CrUX) and Google Lighthouse?
Google PageSpeed Insights brings together two types of data to assess your site’s performance:
Field data: Powered by the Chrome User Experience (CrUX) report, this shows how real visitors experienced your site over the past 28 days.
Lab data: Powered by Google Lighthouse, this is simulated test data that identifies opportunities to improve your site’s speed and usability.
Here’s how each tool works:
Google PageSpeed Insights: Reports the page-level, or origin-level, performance over the past 28 days. It includes insights from both the Chrome User Experience (CrUX) report and Google Lighthouse audits.
Chrome User Experience (CrUX): Uses real visitor data to calculate your site’s Core Web Vitals Assessment. This is the program which tracks all user-centric Core Web Vital metrics.
Google Lighthouse: Uses lab data to calculate your performance score. This tool helps you understand areas of improvement by analyzing performance, SEO, accessibility, and best practices.
Why does my site’s performance score change with every test?
Scores often fluctuate between tests, even if they are performed one after the other. This can be caused by a number of factors, including local networks and CPU load. These metric variabilities have different levels of impact (low, medium, and high), and the Insights report may not have sufficient time to mitigate them.
Variations in scores are generally minimal, and are normal. Scores will also change over time as you update the site.
Why haven't my site's metrics improved after I made changes?
After making changes to your site according to our performance best practices, we recommend waiting at least 3 weeks to see meaningful metric improvements. Although, the full effect will not be seen until the collection period has passed and all your page views are on the updated site.
Collection periods:
Wix Site Speed dashboard: 30 days
Google PageSpeed Insights: 28 days
How could my site's performance have gotten worse since INP replaced FID?
Since INP replaced FID, the experience your visitors have while interacting with your site has not changed. The only difference is which metric Google uses to determine your site’s performance.
With the INP metric’s increased visibility, Wix is striving to optimize your site's performance and develop new ways to improve loading time.
Does upgrading to a higher Wix plan improve site speed?
Upgrading to a higher Wix plan does not directly improve site speed, as all plans provide the same speed capabilities. However, upgrading to a premium plan offers benefits like removing Wix ads, enabling a custom domain, and providing more bandwidth for high-traffic websites. These changes can improve your overall site experience and SEO performance.
How can I test my site's speed effectively?
To gauge your site's performance, you can use the following tools:
Wix Site Speed dashboard for real user data and insights into how visitors are experiencing your site.
Google PageSpeed Insights for simulated performance metrics.
GTmetrix for detailed analysis of loading times and resource usage.
Testing your site across multiple tools ensures a comprehensive understanding of its performance. Browser-specific issues can arise due to compatibility or outdated software.
To troubleshoot: Test your site on multiple browsers and devices. Ensure your browser and device software are up to date. Use Wix's compatibility tools to check for potential issues. For persistent problems, escalate the issue to Wix's support team.
What is Time to First Byte (TTFB), and how can I improve it?
Time to First Byte (TTFB) measures the time it takes for the server to start responding to a browser's request. To improve TTFB, you can:
Use a Content Delivery Network (CDN) to deliver content faster to visitors worldwide.
Minimize the use of heavy scripts or third-party code.
Optimize your site's structure and content to reduce server load.
Improving TTFB ensures a faster initial loading experience for visitors.
How can I improve the performance of a media-heavy site?
Media-heavy websites with lots of images and videos can load slower. To optimize such sites:
Host videos on platforms like YouTube or Vimeo instead of uploading them directly to Wix.
Use lazy loading for non-essential media files.
Compress and resize media files before uploading to ensure faster loading speeds.
These steps help maintain your site's user experience and performance even with high media content.
How does caching affect my website’s performance?
Caching allows your site data to be saved locally on visitors' devices, reducing the time it takes for the site to load on repeat visits. Wix automatically enables caching for your site. To maximize these benefits:
Avoid frequent changes to critical site elements.
Test your site's speed for both first-time and returning visitors.
Caching is crucial for creating a faster, more seamless experience for your users.
This article is credited to the Wix team - https://support.wix.com/ and we thank them for that!